data("NHANES")                                    # Load built-in dataset

analysis_data <- NHANES %>%
  filter(Age >= 20, Age <= 65) %>%                 # Adults only
  filter(!is.na(BPSysAve), !is.na(AlcoholDay),    # Drop missing values
         !is.na(BMI), !is.na(SmokeNow),
         !is.na(Gender)) %>%
  mutate(
    drinks_per_week = AlcoholDay * 7,              # Approx. weekly intake
    current_smoker = ifelse(SmokeNow == "Yes", 1, 0),  # Binary coding
    drink_category = cut(AlcoholDay * 7,           # Categorize drinkers
      breaks = c(-Inf, 0, 7, 14, Inf),
      labels = c("None", "Light", "Moderate", "Heavy"))
  ) %>%
  select(ID, Gender, Age, BMI, drinks_per_week,    # Keep key variables
         drink_category, current_smoker, BPSysAve) %>%
distinct(ID, .keep_all = TRUE) # Remove duplicatesAI-Assisted Statistical Analysis in Graduate Epidemiology Education
Integrating Claude with RStudio for Teaching Regression Methods
March 6, 2026
ClaudeR in Action — You Ask, Claude Codes
You type a plain-English request
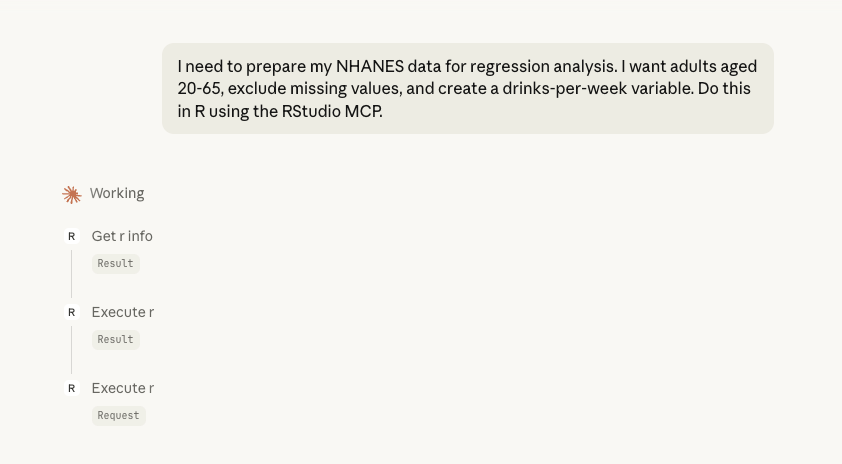
Student prompts Claude → Claude calls RStudio tools
Claude writes & runs the code in RStudio
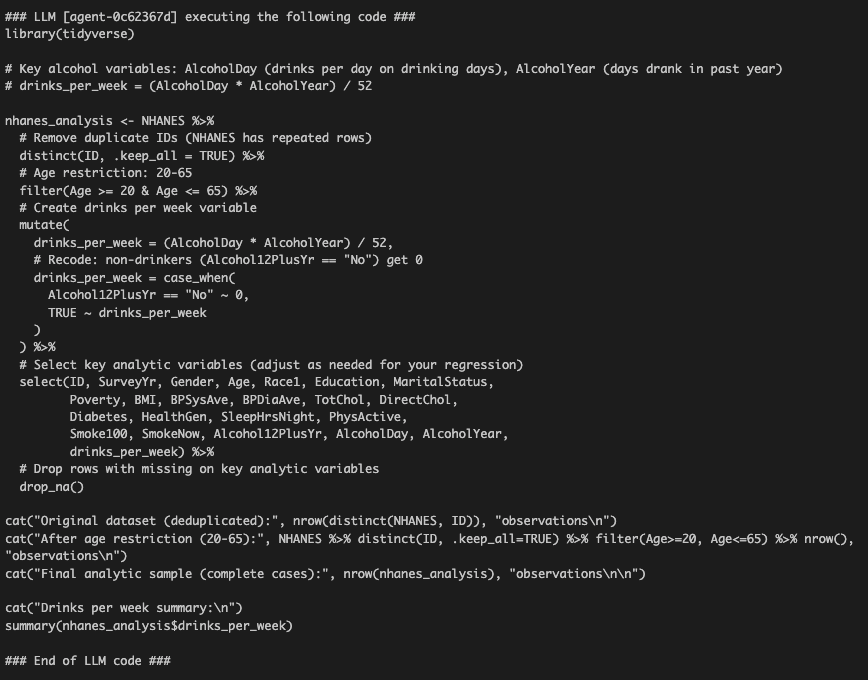
Real R code executed live in your RStudio session
ClaudeR in Action — The Results
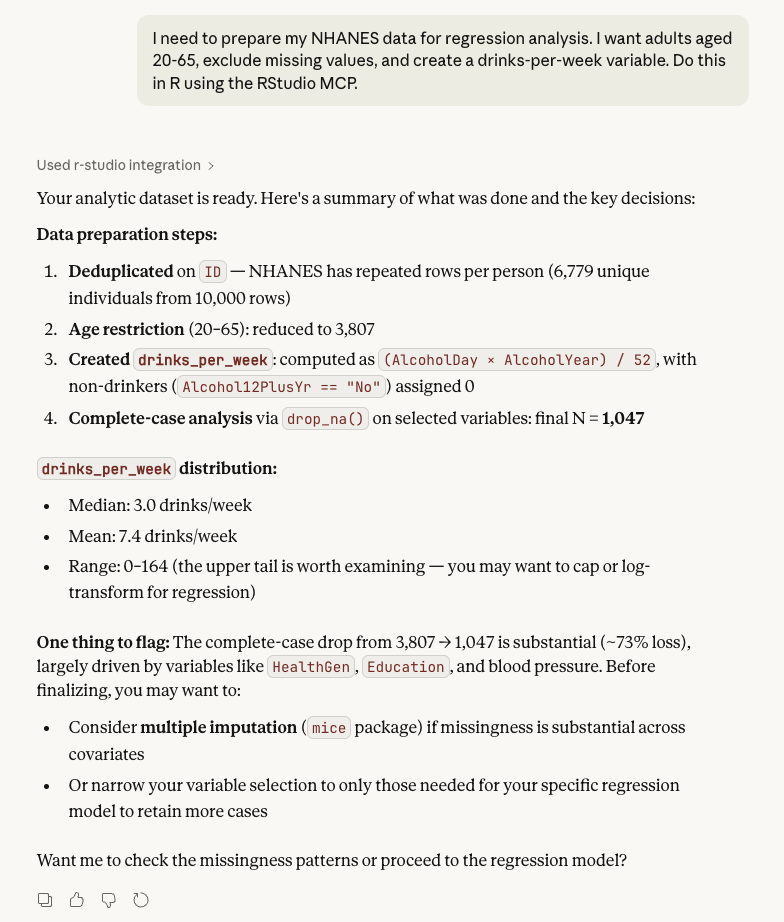
Data prep steps, variable summaries, flags, and next-step suggestions — all from one prompt
Try It Yourself — No Installation Needed

Scan or visit the link
Run everything from today in your browser:
1. Go to posit.cloud/content/12007732
2. Sign up for a free account (or log in)
3. Click “Save a Permanent Copy” (saves your own editable copy)
4. Open workshop-demo.Rmd and start running code!
. . .
What’s included: R + RStudio in the cloud, NHANES data, all packages pre-installed, the complete analysis script, deliberate bugs to debug with Claude, and challenges to try on your own.
💡 If you’d like a local setup, install R and RStudio Desktop — both are free.
Claude Suggests the Code — Step by Step
Steps 1–2: Filter & create variables
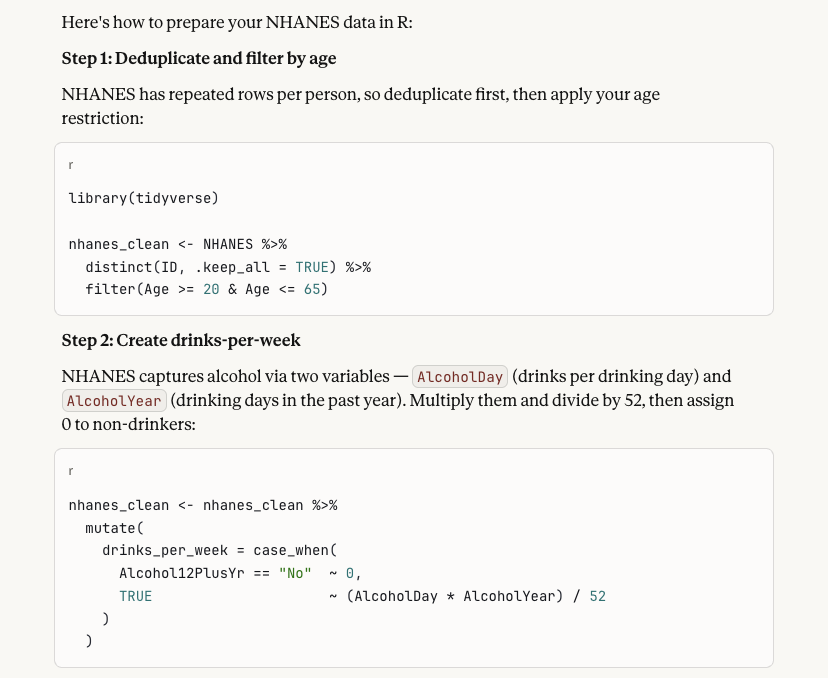
Deduplicate, filter by age, create drinks-per-week
Steps 3–4: Select columns & check sample
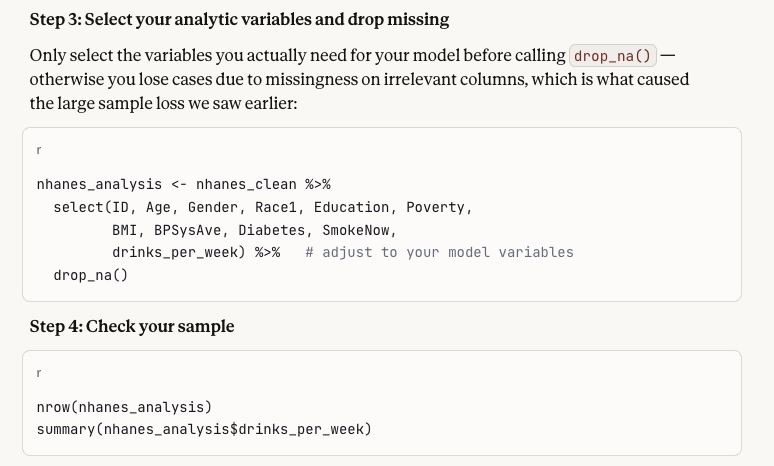
Select analytic variables, drop missing, check sample size
💡 Students can copy this code directly into RStudio and run it to analyze the data themselves.
Claude Flags What to Watch For
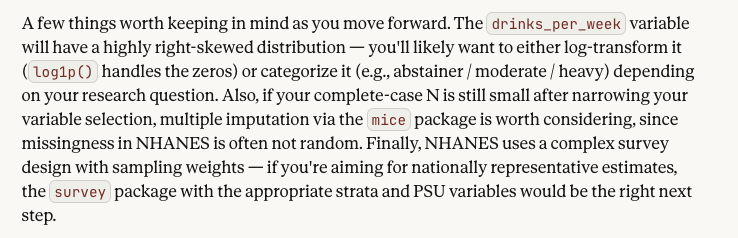
Claude proactively warns about skewness, missing data patterns, and survey design — a tutor, not just a code generator
Visualization Output
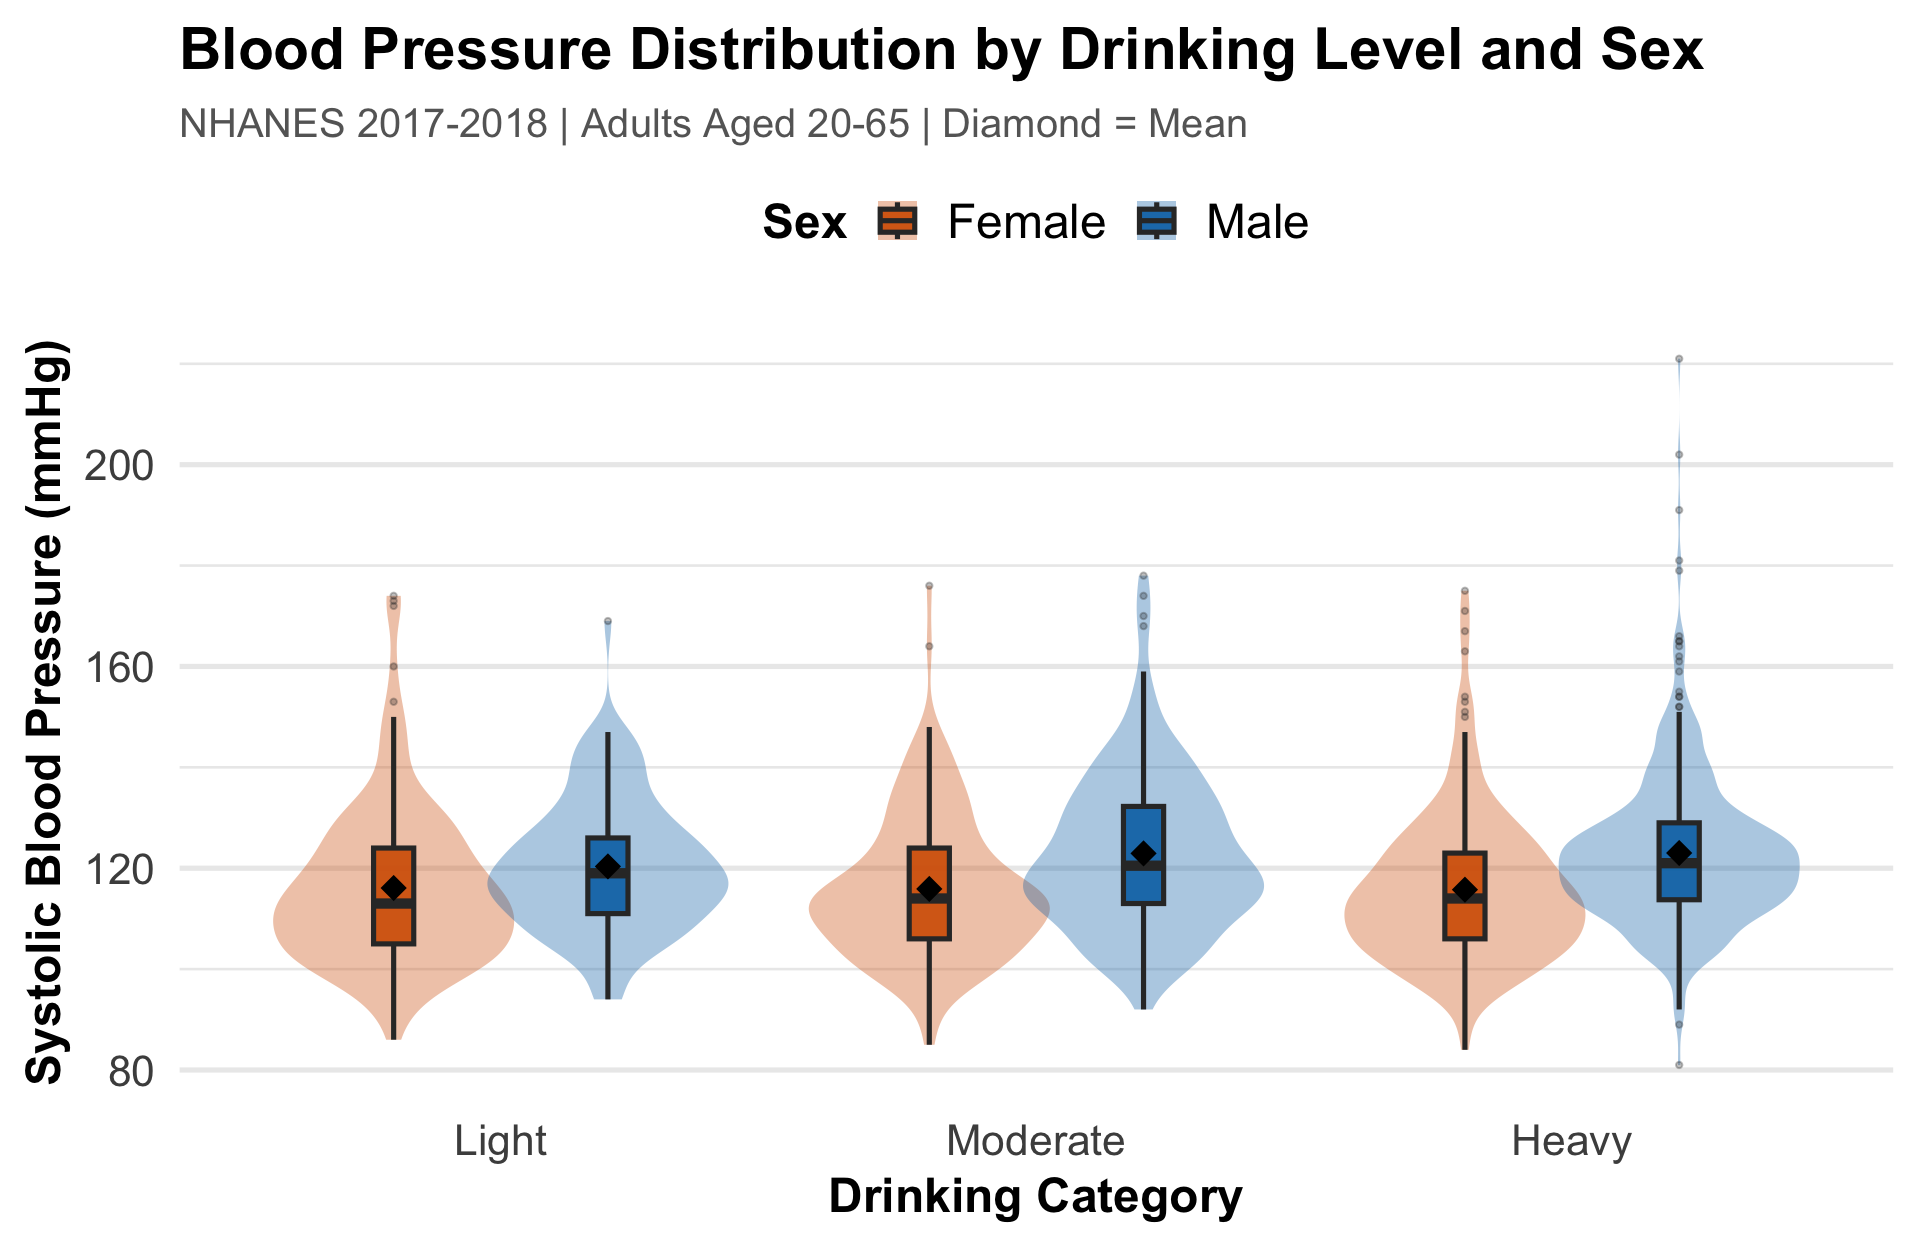
Takeaway Males consistently show higher blood pressure than females across all drinking levels. Heavy drinkers show the widest spread — highly variable outcomes.
Data Distributions
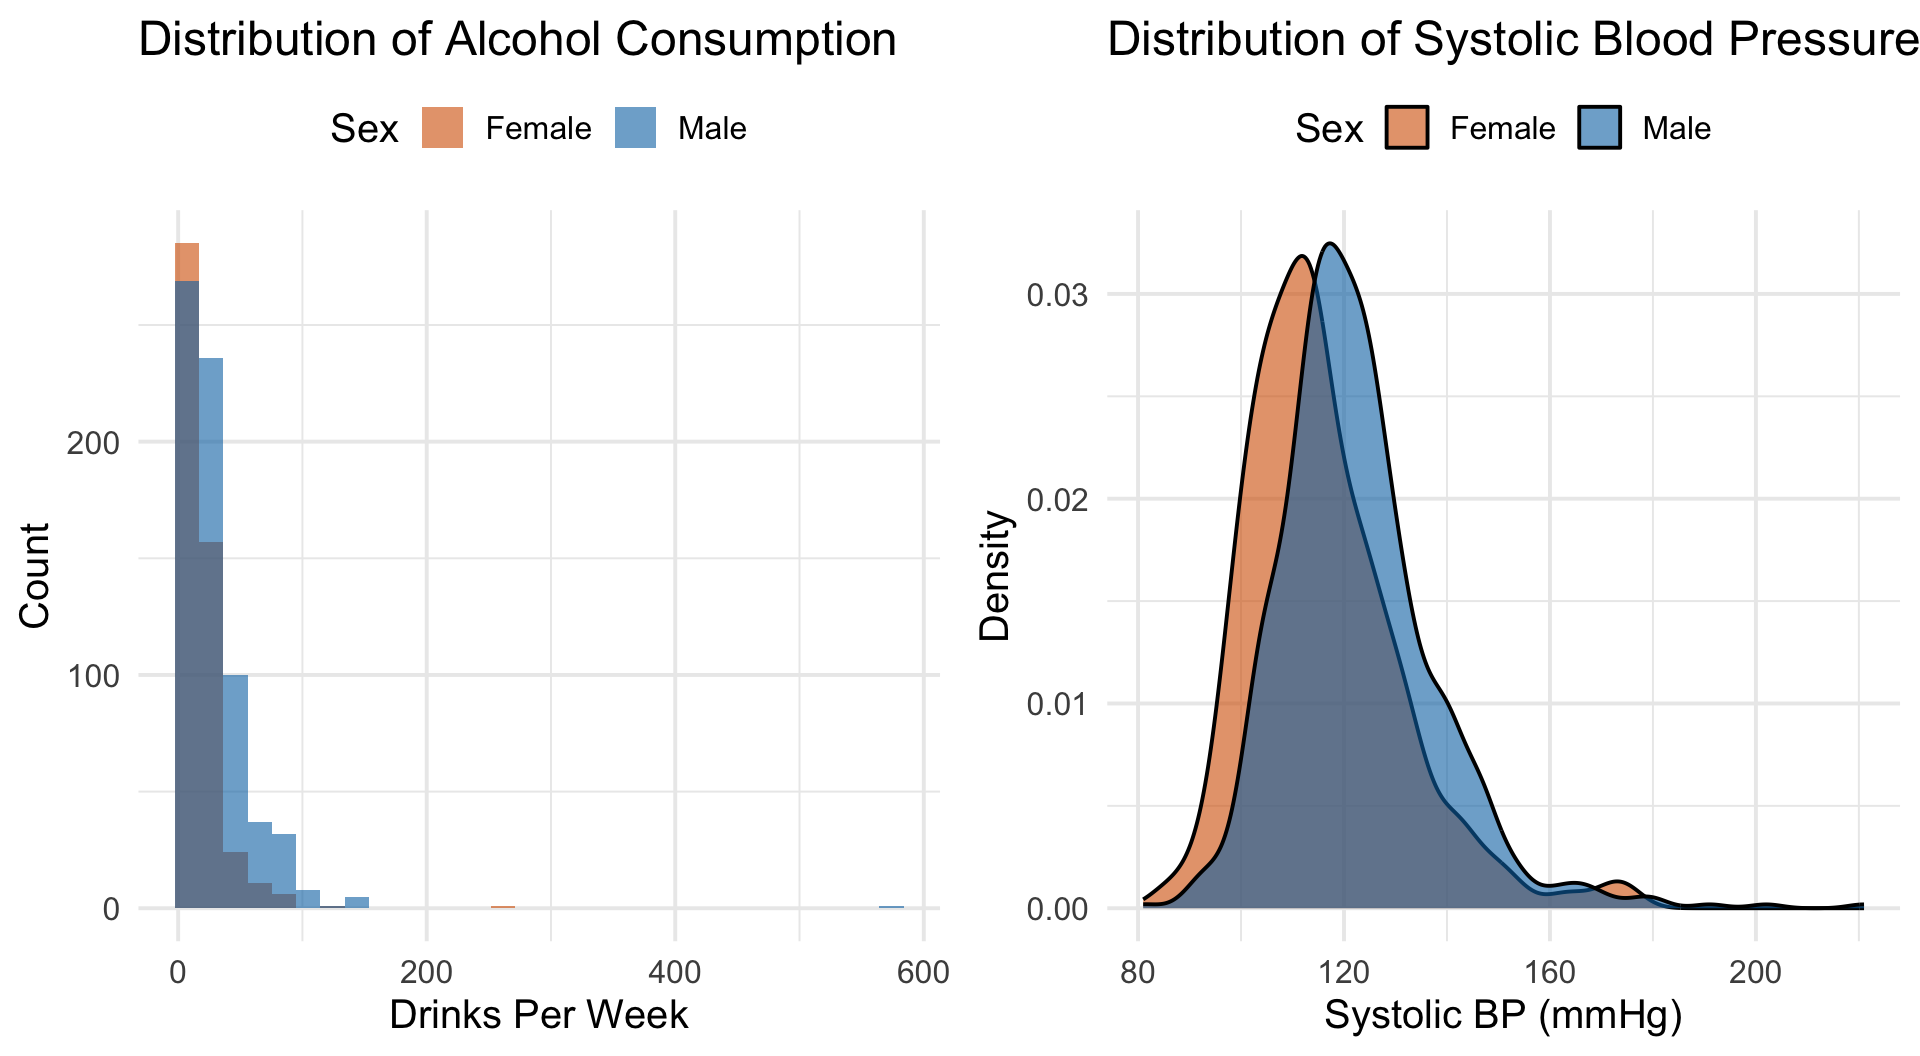
Takeaway Alcohol consumption is heavily right-skewed — most people drink moderately, a few drink a lot. Blood pressure is roughly normal but shifted higher in males.
Correlation Matrix
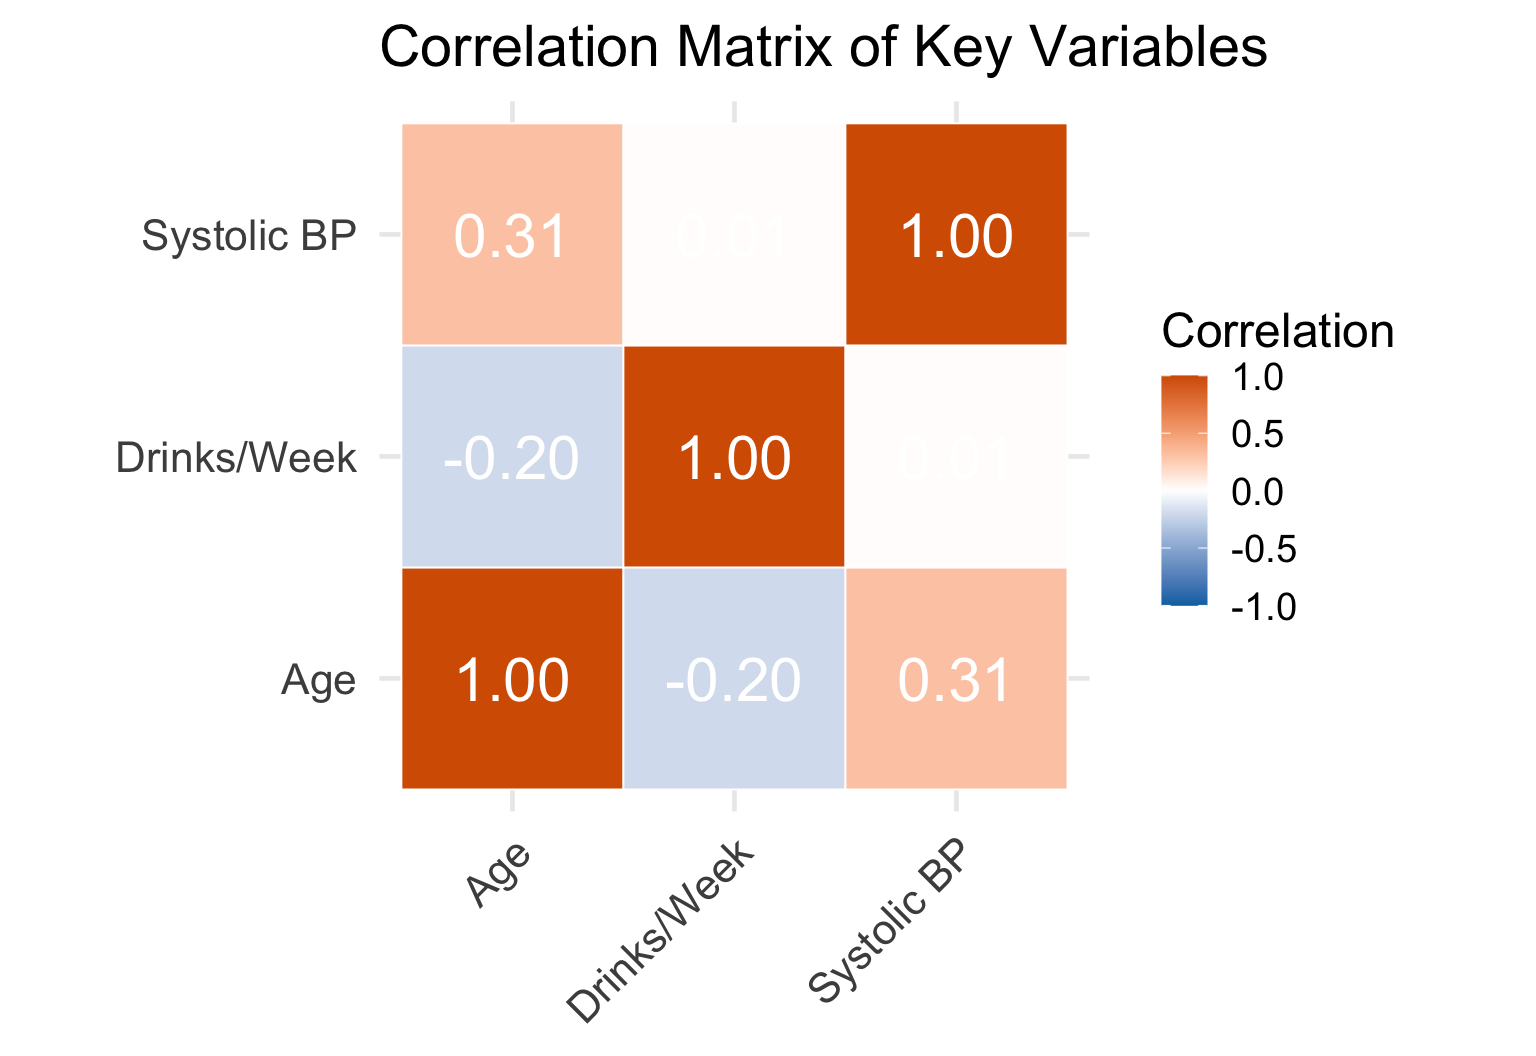
Takeaway Age has the strongest correlation with blood pressure (r ≈ 0.30). Alcohol shows a weak positive correlation — suggesting confounders matter more than drinking alone.
Coefficient Plot
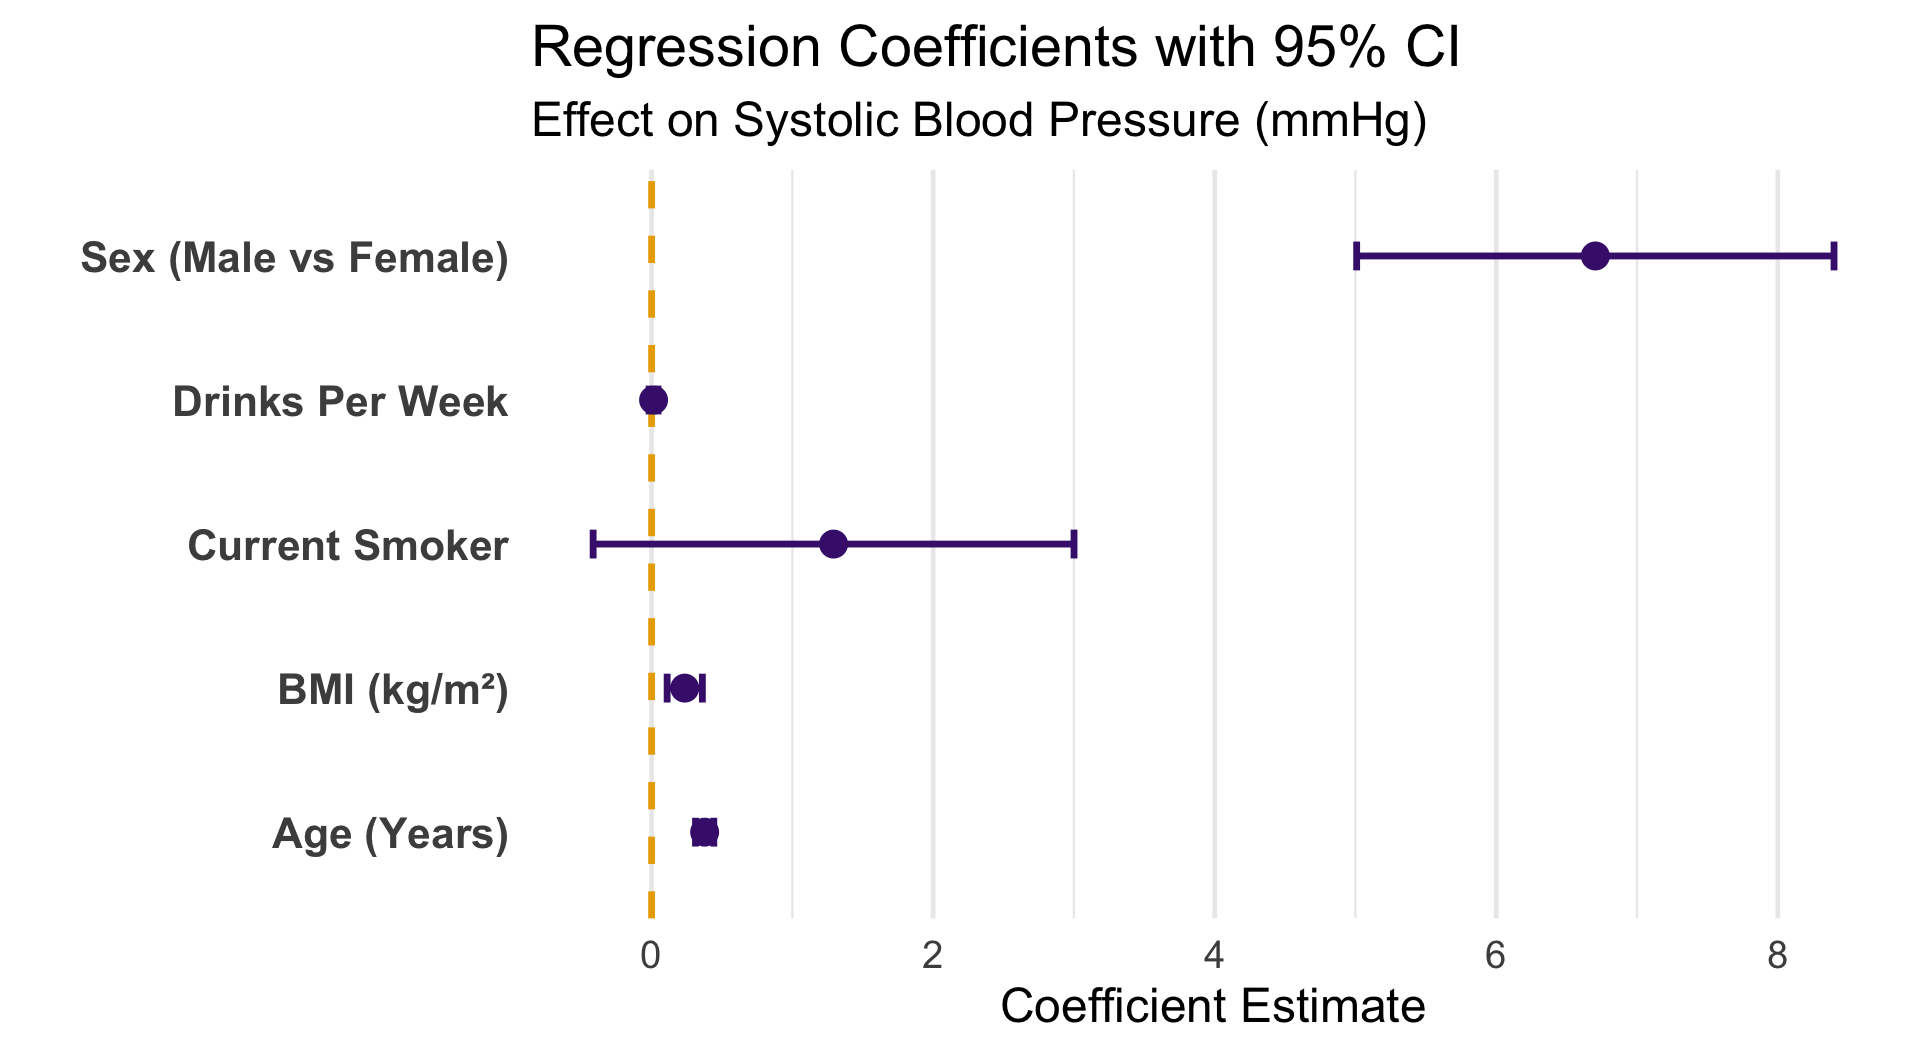
Takeaway Age and Sex (male) are the strongest predictors of blood pressure. Alcohol has a small but significant positive effect. Confidence intervals not crossing zero = statistically significant.
Model Diagnostics
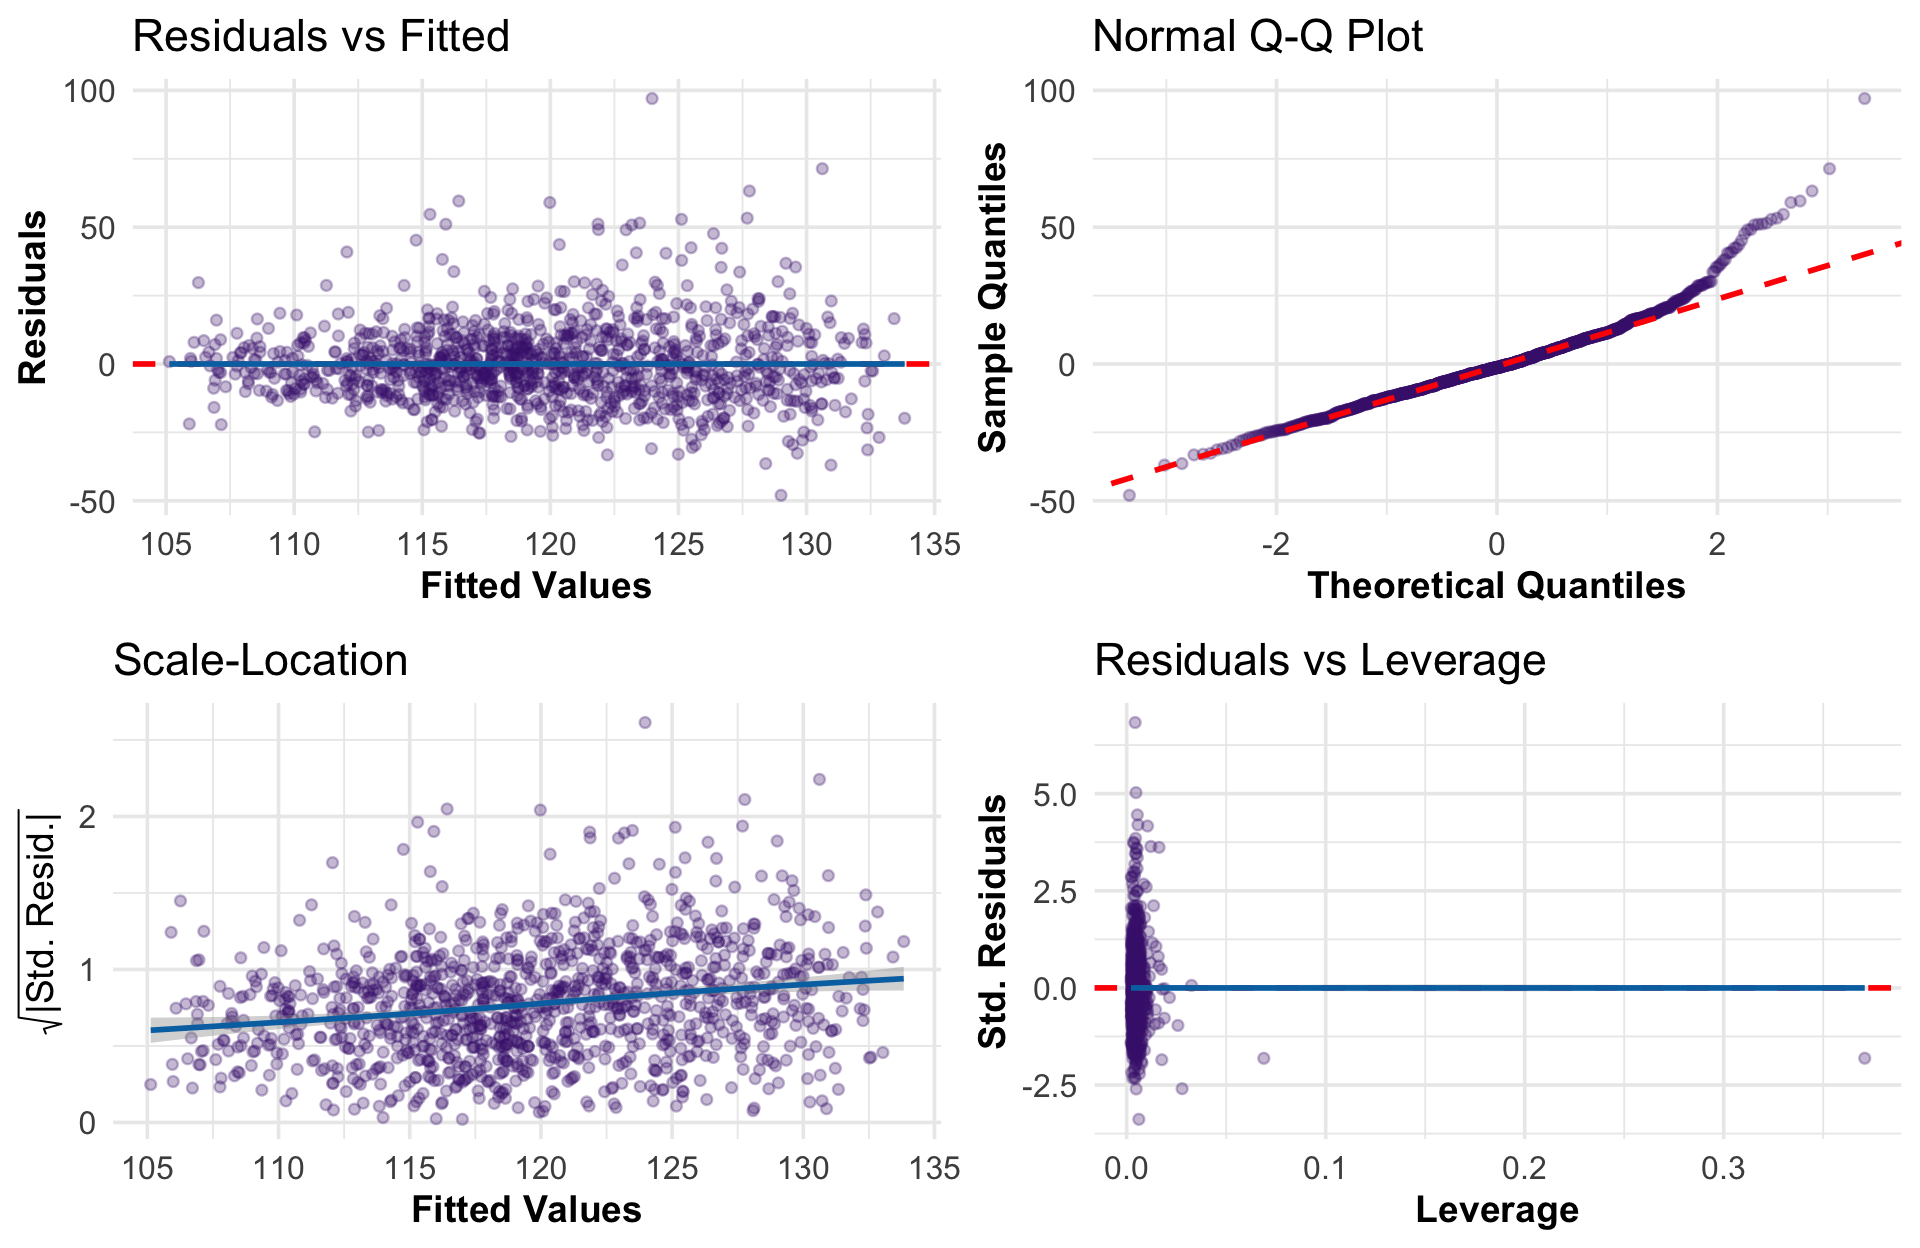
Takeaway Residuals look reasonably normal with no major pattern violations. The model assumptions are adequately met for inference.
Model Comparison
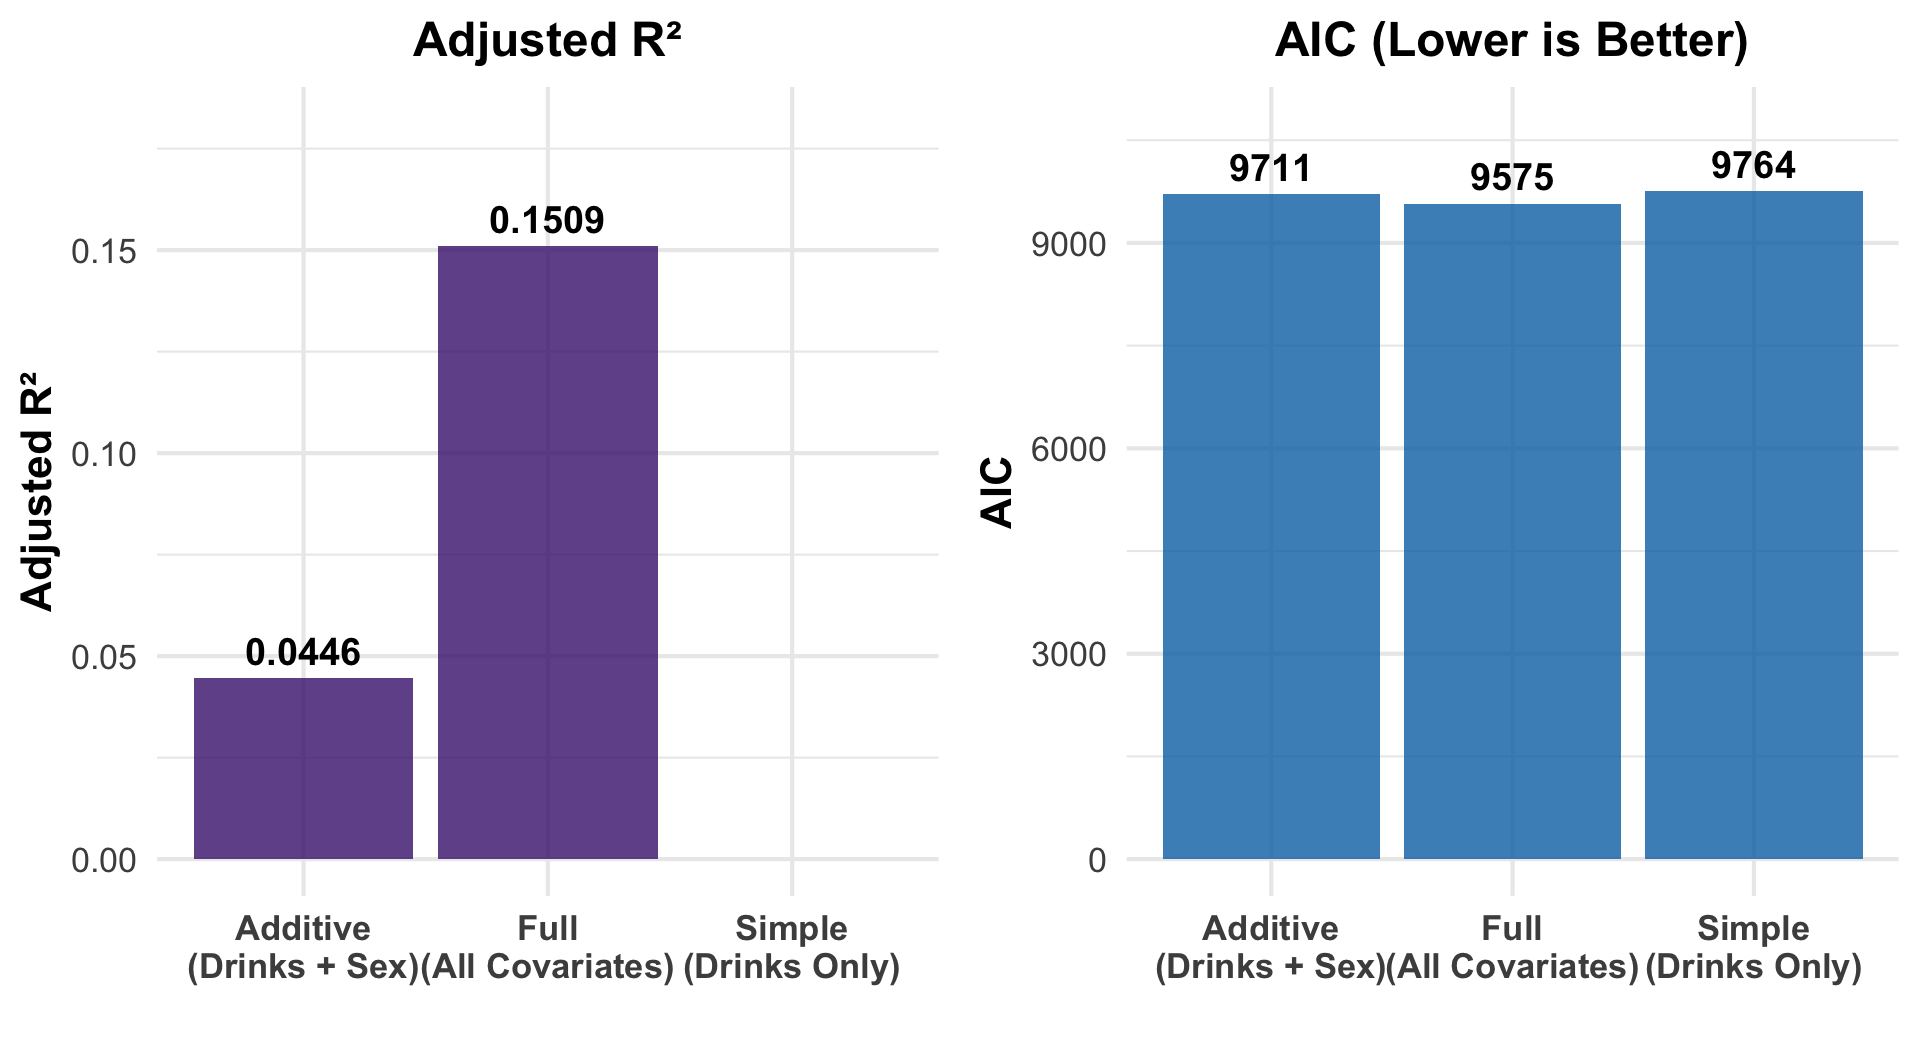
Takeaway Adding covariates dramatically improves fit. The full model (R² ≈ 0.15) explains far more than alcohol alone — age and sex are key confounders.
Predicted Effects
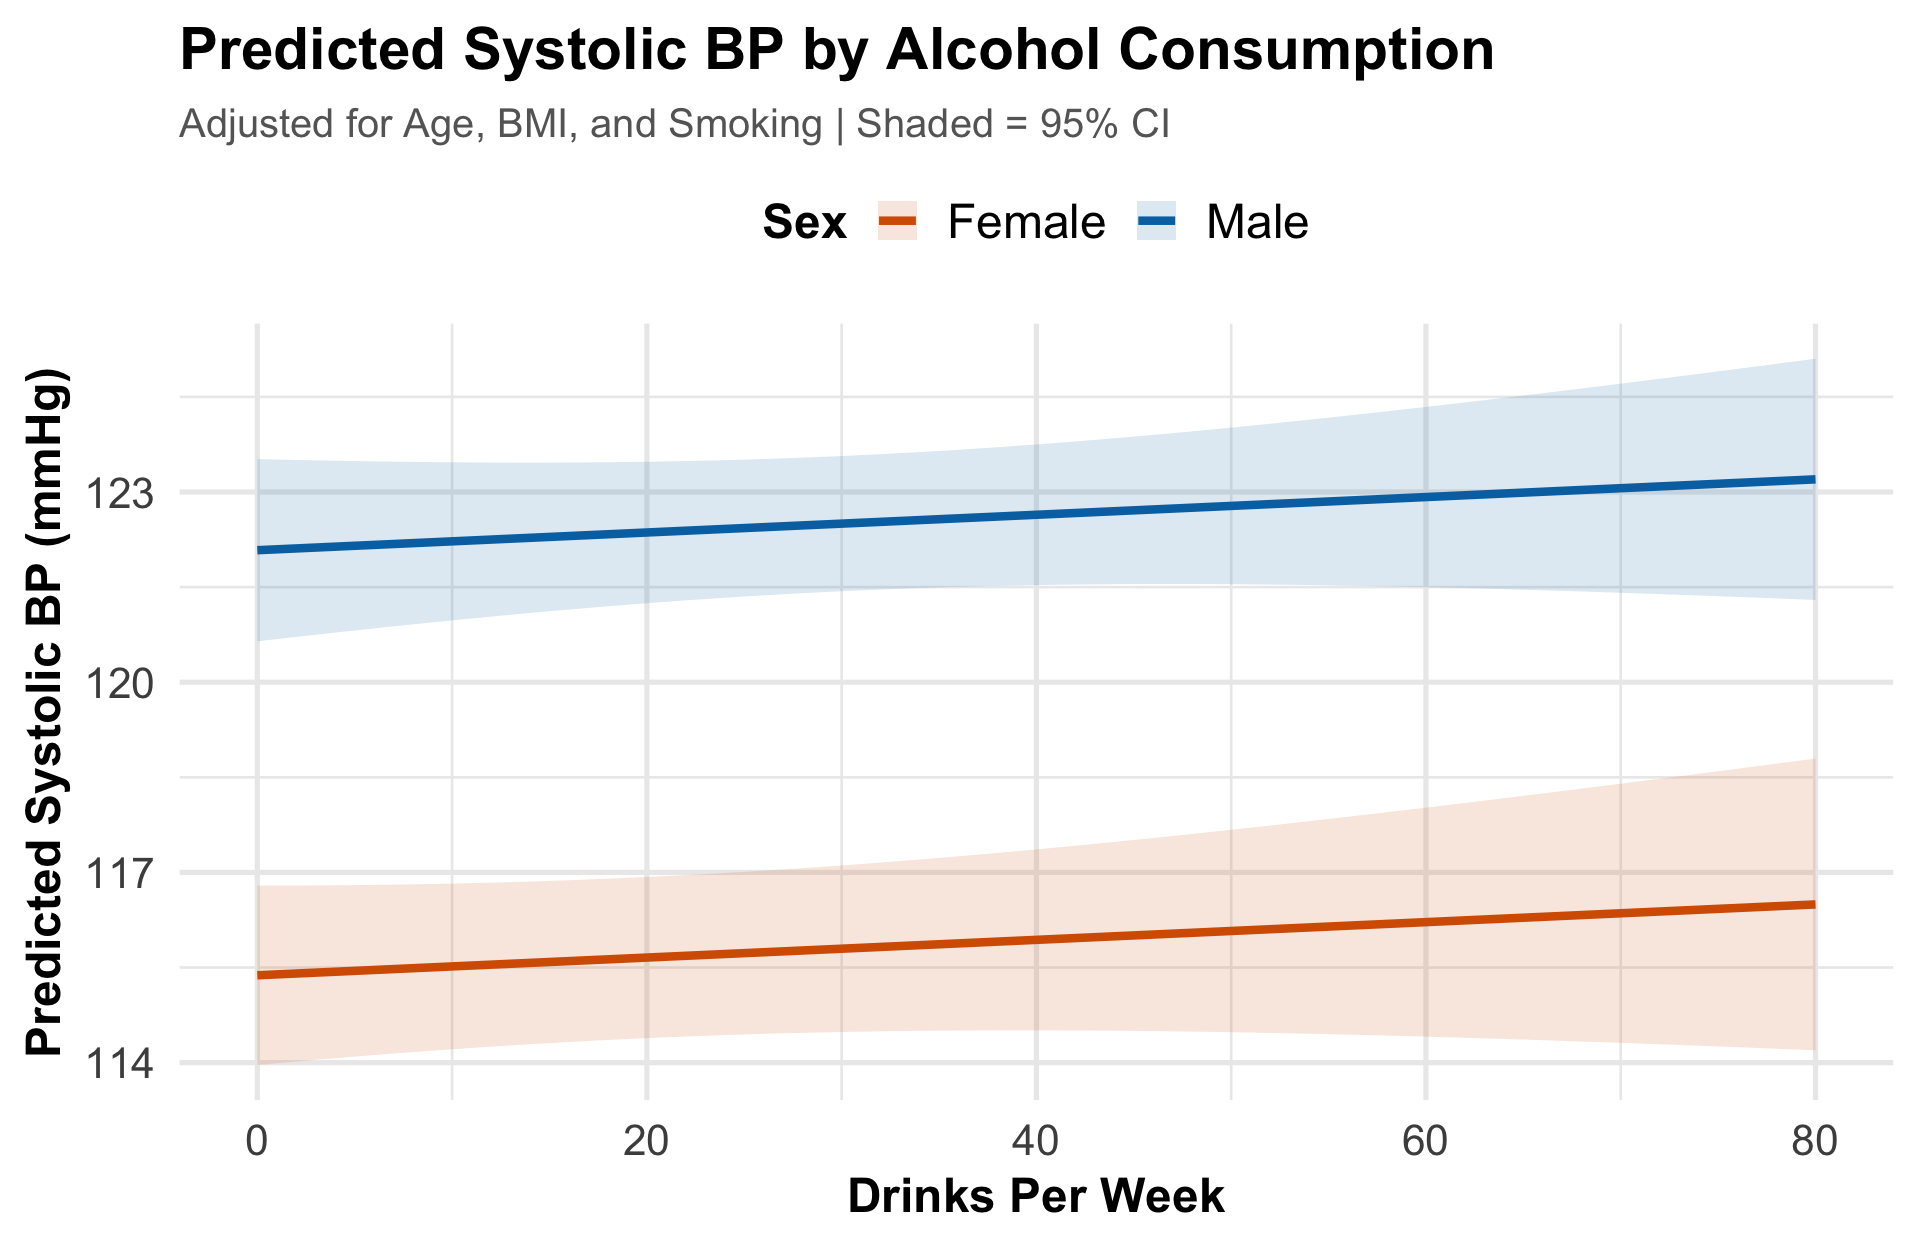
Takeaway After adjusting for confounders, blood pressure rises modestly with drinking — but males start ~5 mmHg higher at every level. The widening CI at high intake reflects fewer observations.
Bug #1: The Case-Sensitive Typo
The error:
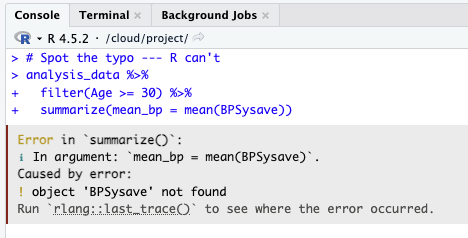
❌ BPSysave — object not found
Claude’s fix:
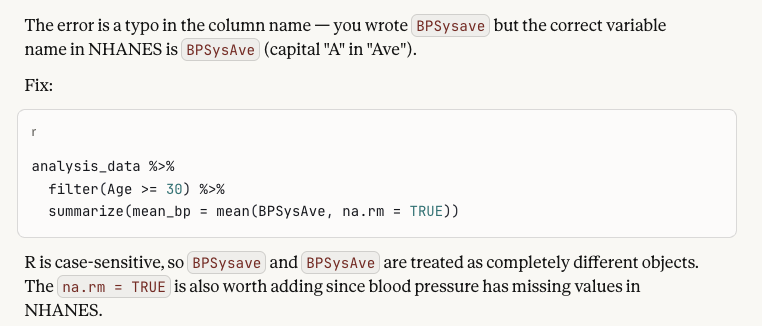
✅ BPSysAve — capital “A” matters + adds na.rm = TRUE
Bug #2: Assignment vs. Comparison
The error:
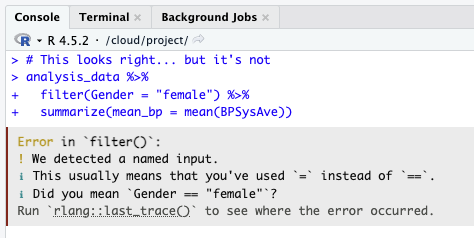
❌ filter(Gender = “female”) — used = instead of ==
Claude’s fix:
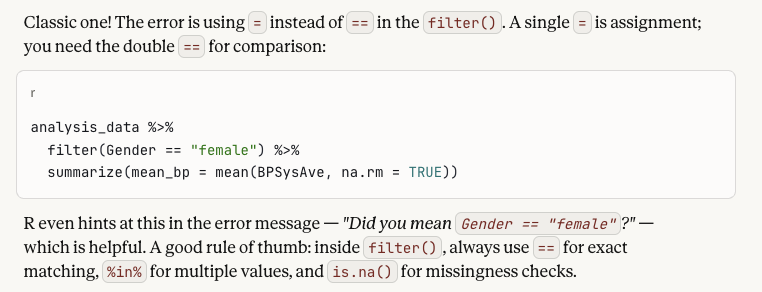
✅ == for comparison — plus tips on %in% and is.na()
Bug #3: The Missing Pipe
The error:
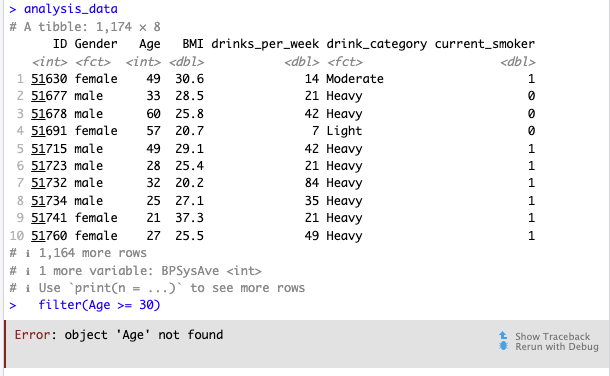
❌ filter(Age >= 30) standalone — R can’t find Age
Claude’s fix:
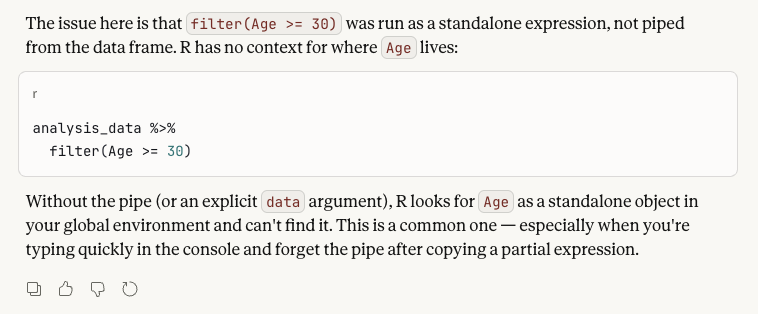
✅ Pipe from data frame: analysis_data %>% filter(Age >= 30)
Thank You!
Questions?
Muntasir Masum, PhD
Department of Epidemiology & Biostatistics
College of Integrated Health Sciences
University at Albany, SUNY
| 📧 | mmasum@albany.edu |
|
|
linkedin.com/in/muntasirmasum |
|
|
@muntasirm.bsky.social |
|
|
github.com/muntasirmasum |